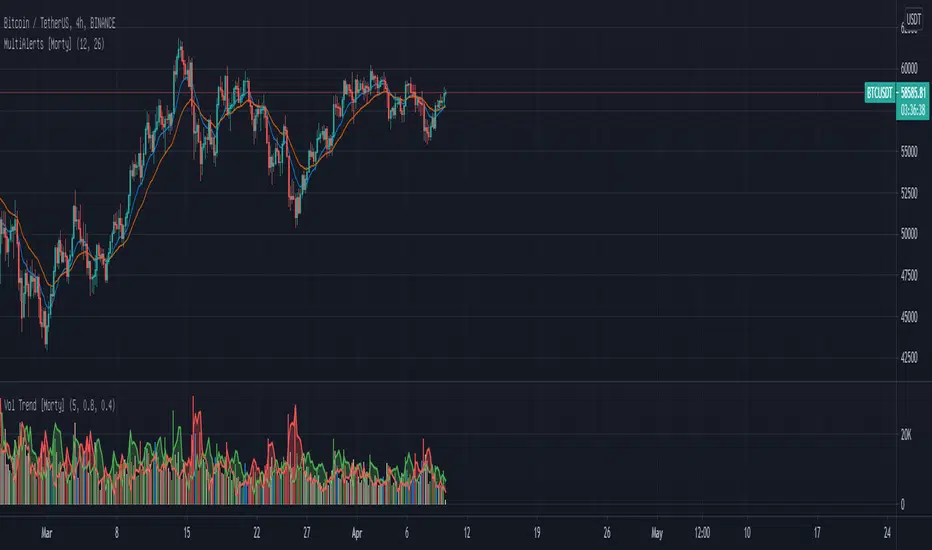
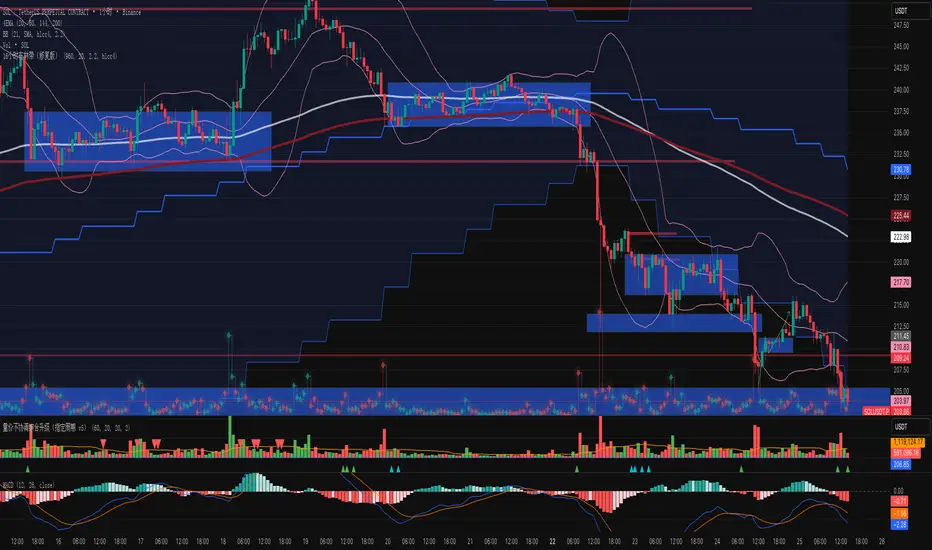
WTT Volume Trend [Morty]WTT Volume Trend by Morty
Inspired by Natural Trading Theory
It is a colored volume indicator based on the strength of single candlestick pattern.
It also paints two weighted volume SMA, which shows the strength and trend of the market.
Version 1.0, Updated at 20210327
Features:
- Colored volume bars (Optional)
- Weighted Bullish volume SMA trend lines according to candlestick pattern
- Weighted Bearish volume SMA trend lines according to candlestick pattern
- Adjustable volume SMA length
- Adjustable weighting factors
- Filling the background between volume SMA trend lines
Поиск скриптов по запросу "VOLUME BAR"
Volume Brakeout v1Volume Brakout indicator is used to help determine trend direction strictly based on Negative and Positive volume data.
How to Read:
- Moving Average crossovers are used to help determine a possible trend change or retracement.
- The area cloud on the bottom is calculated by the difference of the moving averages. This could be used to help determine the trending volume strength.
- Bright colored volume bars are large volume spikes calculated by the x factor in the options.
Other changes:
- Volume Depth is going open source with numerous of its indicators. This is only one of many!
- Volume is now displayed without being altered for calculations.

Volume Flow v3DepthHouse Volume Flow indicator is used to help determine trend direction strictly based on Negative and Positive volume data.
How to Read:
- Moving Average crossovers are used to help determine a possible trend change or retracement.
- The area cloud on the bottom is calculated by the difference of the moving averages. This could be used to help determine the trending volume strength.
- Bright colored volume bars are large volume spikes calculated by the x factor in the options.
Other changes:
- DepthHouse is going open source with numerous of its indicators. This is only one of many!
- Volume is now displayed without being altered for calculations.

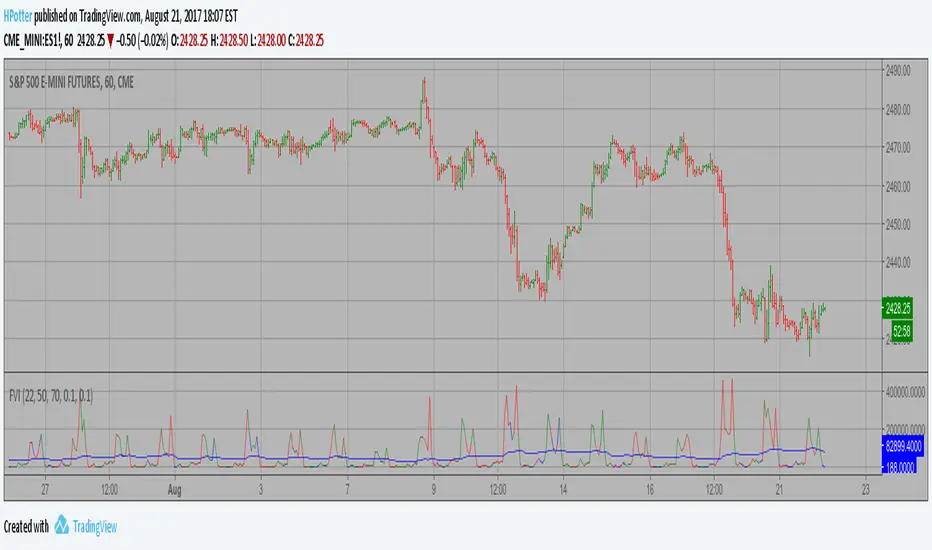
Volatility Finite Volume Elements Strategy The FVE is a pure volume indicator. Unlike most of the other indicators
(except OBV), price change doesn?t come into the equation for the FVE
(price is not multiplied by volume), but is only used to determine whether
money is flowing in or out of the stock. This is contrary to the current trend
in the design of modern money flow indicators. The author decided against a
price-volume indicator for the following reasons:
- A pure volume indicator has more power to contradict.
- The number of buyers or sellers (which is assessed by volume) will be the same,
regardless of the price fluctuation.
- Price-volume indicators tend to spike excessively at breakouts or breakdowns.
This study is an addition to FVE indicator. Indicator plots different-coloured volume
bars depending on volatility.
Volume-Price Divergence Indicator V3Description:
This indicator helps you identify volume-price divergences and potential trend weakness across any specified timeframe.
Features:
Volume bars with moving average – green for bullish, red for bearish, with orange SMA to detect low-volume situations.
Custom OBV calculation with divergence detection – highlights when price makes new highs/lows but OBV does not.
VWAP deviation alerts – signals when price moves far from VWAP while volume remains low, indicating potential fake breakouts.
Fully configurable – select any reference timeframe, adjust volume MA, OBV period, and VWAP deviation threshold.
Visual markers – easily spot bullish/bearish divergences and volume-price mismatches directly on your chart.
Use case:
Spot early trend exhaustion points.
Identify fake breakouts or weak rallies/drops.
Combine with your existing trading strategy for more informed entries and exits.
Volume-Price Divergence Indicator V2Description:
This indicator helps you identify volume-price divergences and potential trend weakness across any specified timeframe.
Features:
Volume bars with moving average – green for bullish, red for bearish, with orange SMA to detect low-volume situations.
Custom OBV calculation with divergence detection – highlights when price makes new highs/lows but OBV does not.
VWAP deviation alerts – signals when price moves far from VWAP while volume remains low, indicating potential fake breakouts.
Fully configurable – select any reference timeframe, adjust volume MA, OBV period, and VWAP deviation threshold.
Visual markers – easily spot bullish/bearish divergences and volume-price mismatches directly on your chart.
Use case:
Spot early trend exhaustion points.
Identify fake breakouts or weak rallies/drops.
Combine with your existing trading strategy for more informed entries and exits.
Volume-Price Divergence Indicator (OBV + VWAP, Multi-Timeframe)Description:
This indicator helps you identify volume-price divergences and potential trend weakness across any specified timeframe.
Features:
Volume bars with moving average – green for bullish, red for bearish, with orange SMA to detect low-volume situations.
Custom OBV calculation with divergence detection – highlights when price makes new highs/lows but OBV does not.
VWAP deviation alerts – signals when price moves far from VWAP while volume remains low, indicating potential fake breakouts.
Fully configurable – select any reference timeframe, adjust volume MA, OBV period, and VWAP deviation threshold.
Visual markers – easily spot bullish/bearish divergences and volume-price mismatches directly on your chart.
Use case:
Spot early trend exhaustion points.
Identify fake breakouts or weak rallies/drops.
Combine with your existing trading strategy for more informed entries and exits.
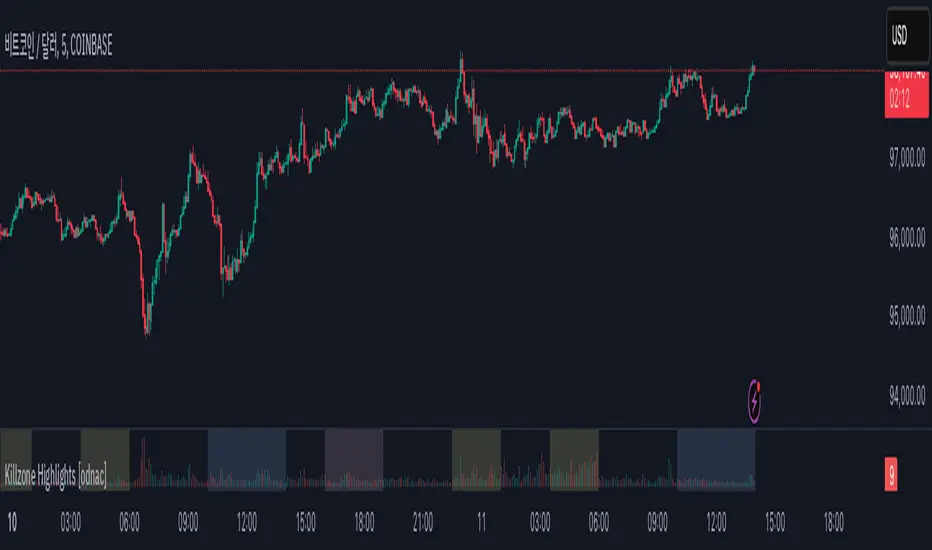
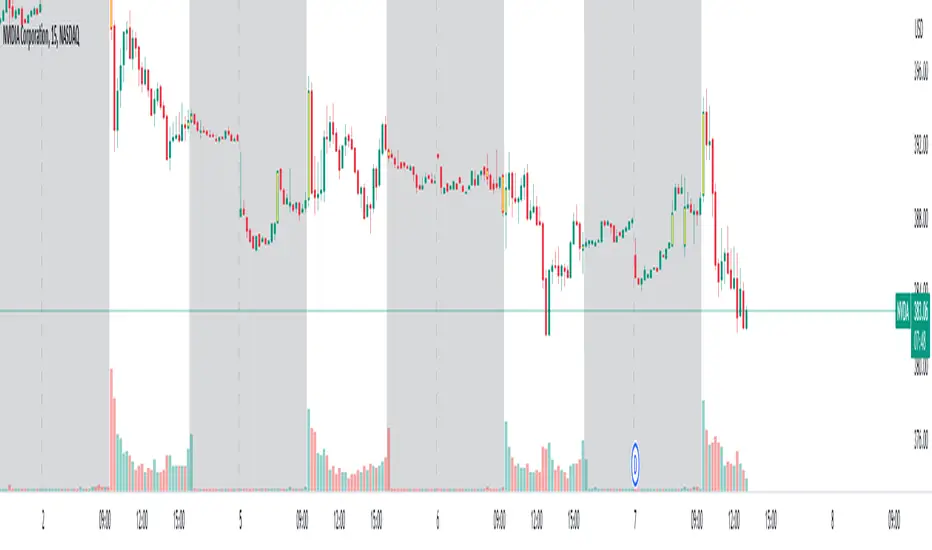
Killzone Highlights with Volume [odnac]
Description:
This indicator seamlessly integrates volume analysis with kill zone highlights across different market sessions.
The indicator dynamically displays trading volume and visually emphasizes key trading sessions in various time zones, including Asia, Europe, and New York (both AM and PM sessions).
Users have the flexibility to customize the colors of bullish and bearish volume bars, as well as the transparency and color of the kill zone highlights, allowing for tailored visual analysis of trading periods.
Features:
Bullish and Bearish Volume Colors:
Displays the volume of trades with user-defined colors for bullish (up) and bearish (down) candles.
Killzone Highlights:
Highlights the kill zones for Asia, Europe, New York AM, and New York PM sessions with user-defined colors and transparency.
Customization Options:
Allows users to adjust the colors, transparency, and time settings for each kill zone.
Weekend Handling:
Option to hide kill zone highlights during weekends.
Timeframe Limitation:
Users can set the maximum timeframe for which the kill zone highlights will be displayed.
Usage:
This indicator is designed for traders who want to gain insights into market activity during key trading sessions.
By combining volume data with visually distinct kill zone highlights, it helps traders make informed decisions based on the most active trading periods.
Ideal for intraday traders looking to leverage session-based strategies for more effective trading decisions.
Uniform Volume ProfileUniform Volume Profile
The volume of a single candlestick is uniformly distributed by its range (high - low) along all the colliding volume profile bars.
For example, if a 10% of a candlestick intersects some volume bar (horizontal line) only the 10% of that candlestick volume will contribute to that profile.

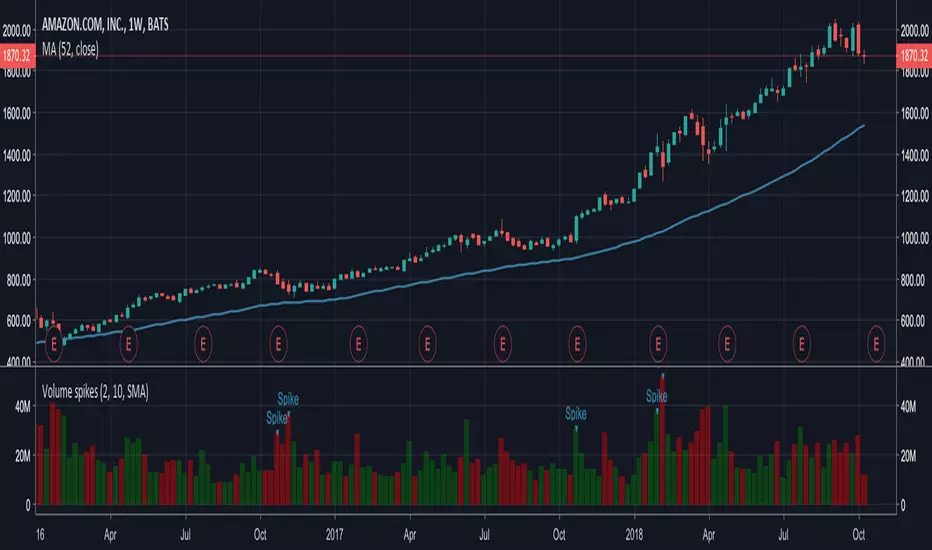
Volume spikesSimple indicator which shows volume spikes.
By default spike is defined as such when volume is 2 times higher than average volume for last 10 volume bars (this can be changed in settings)
Also instead of using average volume (SMA is used in this case) you can use WMA or EMA by changing settings
Hullfib-trailingso I add a trialing function based on volume pf the bars
this will ,ake the system more easy for the trader
1. Hull mean avreage with color changes (green -red that show the trend )
2. signal prouduce by Hull and bollinger fibs
3.signal prouduce by trailing volume bars (B , S)
4. upper and lower daily fibs
togetther you can make good combination when you bet on bitmex
have fun


VP-Period with Previous Day Levels & Historical POC# Volume Profile with Previous Day Levels & Historical POCs
## Description
Comprehensive indicator combining Volume Profile analysis, previous day levels, and historical POC (Point of Control) levels for advanced technical analysis.
## Key Features
### Volume Profile
- **Customizable period**: 3 to 500 days
- **Calculation resolution**: 400 to 700 points
- **Current VPOC**: Point of Control line for current period
- **Volume bars**: graphical display of volume profile distribution
### Historical POCs
- **POC history**: up to 20 previous days
- **Time labels**: shows how many days ago for each POC
- **Dashed lines**: easy identification of historical levels
### Previous Day Levels (last 5 days)
- **High/Low**: daily highs and lows
- **Midpoint**: 50% level (High+Low)/2
- **Open/Close**: opening and closing prices
- **Progressive thickness**: day 1 thicker, decreasing for previous days
## Customization
- Fully configurable colors for each element
- Toggle on/off switches for every component
- Different line styles (solid, dashed, dotted)
## Usage
Perfect for traders using volume analysis and support/resistance based on previous daily levels. Ideal for identifying key zones and significant breakout points.
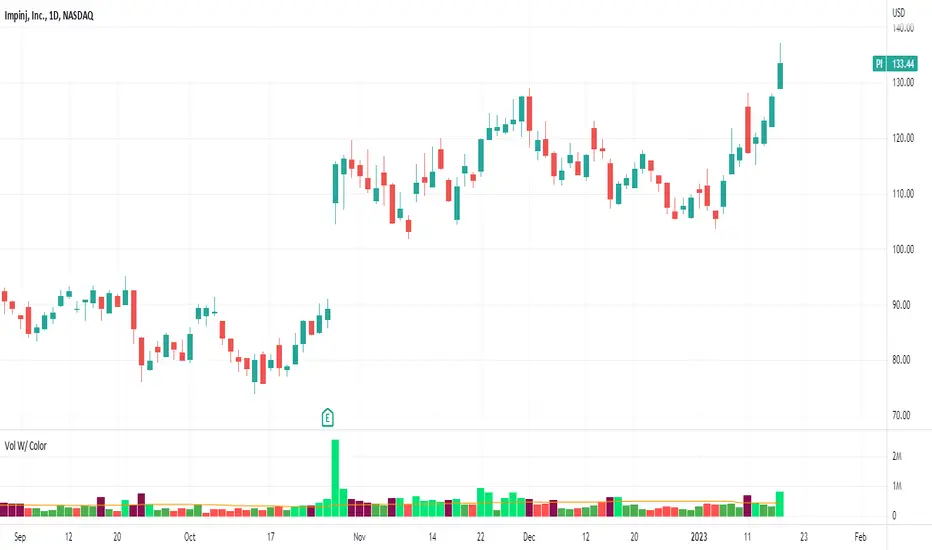
Volume With ColorVolume with color helps to quickly identify accumulation or distribution.
An accumulation day is an up day with volume greater than a user selected average.
A distribution day is a down day with volume greater than a user selected average.
This indicator will highlight those days by changing the volume bar colors for an easy visual.
Candle Colored by Volume Z-score [Morty]This indicator colors the candles according to the z-score of the trading volume. You can easily see the imbalance on the chart. You can use it at any timeframe.
In statistics, the standard score (Z-score) is the number of standard deviations by which the value of a raw score (i.e., an observed value or data point) is above or below the mean value of what is being observed or measured. Raw scores above the mean have positive standard scores, while those below the mean have negative standard scores.
This script uses trading volume as source of z-score by default.
Due to the lack of volume data for some index tickers, you can also choose candle body size as source of z-score.
features:
- custom source of z-score
- volume
- candle body size
- any of above two
- all of above two
- custom threshold of z-score
- custom color chemes
- custom chart type
- alerts
default color schemes:
- green -> excheme bullish imbalance
- blue -> large bullish imbalance
- red -> excheme bearish imbalance
- purple -> large bearish imbalance
- yellow -> low volume bars, indicates "balance", after which volatility usually increases and tends to continue the previous trend
Examples:
* Personally, I use dark theme and changed the candle colors to black/white for down/up.
Volume as Z-score source
Any as Z-score source, more imbalances are showed

Heatmap Volume [xdecow]This indicator colors the volume bars and candles according to the volume traded. The calculation of the heat map zones is done as follows:
how many standard deviations the volume are distant from the average volume?
For a better visual experience, place the borders and wicks of the candles in a neutral color.

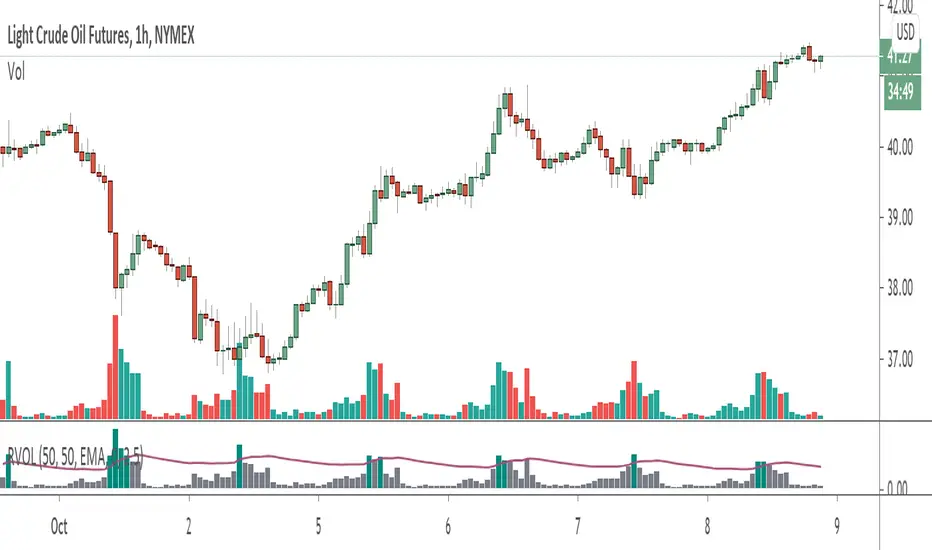
Volume+ (RVOL/Alerts)This indicator colors the volume bars based on any of the three follow criteria:
- Volume Amount
- RVOL (Relative Volume)
- Lookback (Highest Over Period)
You can use one, two or all three of these settings at the same time.
You can also set alerts with this indicator. The script will trigger an alert whenever any of the three specified flags are triggered.
RVOL is calculated as: Volume divided by Moving Average value. You can change the moving average period (and type) in the settings.
Instant Volume Flow1. Volume Bars (Green/Red)
Shows instantly whether buyers or sellers are dominant.
2. Delta Volume Histogram
Green = net buying pressure
Red = net selling pressure
This lets you spot:
Big sell dumps
Sudden buy absorption
Volume momentum shifts
3. Spike Alerts
You get alerts when volume is more than 2× the 20-MA average volume.

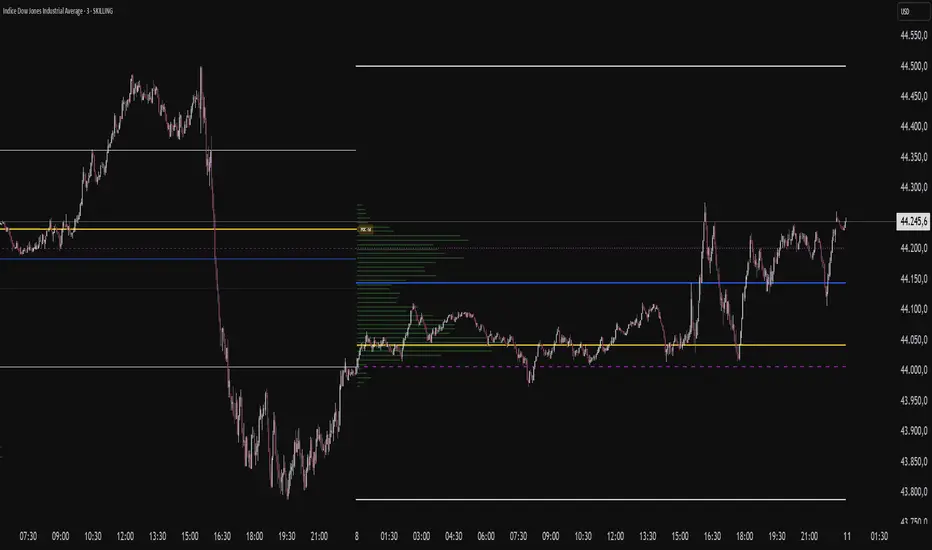
Vector CPR Bands## Overview
The Vector CPR Bands indicator enhances the classic Central Pivot Range (CPR) by incorporating "vector" detection—identifying periods with above-average or climactic volume. It projects CPR ranges from these high-volume periods forward as visual bands, which act as persistent support/resistance zones until invalidated by price action. Ideal for spotting key levels in trending or ranging markets, especially on higher timeframes like weekly or monthly.
## Key Features
- **CPR Calculation**: Plots previous, developing (non-repainting), and repainting CPR with mid-pivot, TC (top central), and BC (bottom central) lines, plus fills.
- **Vector Detection**: Scans for high-volume bars in the anchor timeframe (default weekly). Flags "above-average" (≥1.5x avg) or "large" (≥2x avg or max climax).
- **Band Projection**: Creates bands from vector-qualified CPR periods. Extends them rightward until touched/revisited (configurable: invalidate on wick/close, delete or freeze/gray out).
- **Customization**:
- Timeframe: Set CPR anchor (e.g., 'W' for weekly, 'M' for monthly).
- Display: Toggle CPR types, pivot guides.
- Volume Thresholds: Adjust lookback and ratios.
- De-clutter: Limit max bands, pin to period start, always extend.
- **Alerts & Signals**: Built-in alerts for developing pivot crossing previous pivot (bullish/bearish).
## How to Use
1. Add to chart and set anchor timeframe (e.g., 'M' for monthly vCPR on BTC, as shown in example charts).
2. Watch bands as S/R: Virgin (untested) bands often provide strong bounces; mitigated ones fade.
3. Combine with volume/price action: Bullish bands suggest upside bias, especially if price holds above.
4. Example: On BTC weekly, vector bands from high-volume weeks highlight multi-month zones—breaks signal shifts.

ETN - Volume CandleHighlights candlestick based on volume data.
Indicator looks back and analyzing volume to find the volume bar with the largest numerical value
Indicator highlights the corresponding candlestick .
Indicator marks the high and low of that candlestick.
Users can adjust lookback period. Default is set to 50 .
Users can adjust how the indicator plots the high and low.
I currently have the high and low not being displayed on the charts until I come up with a better version.
On my chart, indicator colored the candlesticks YELLOW.
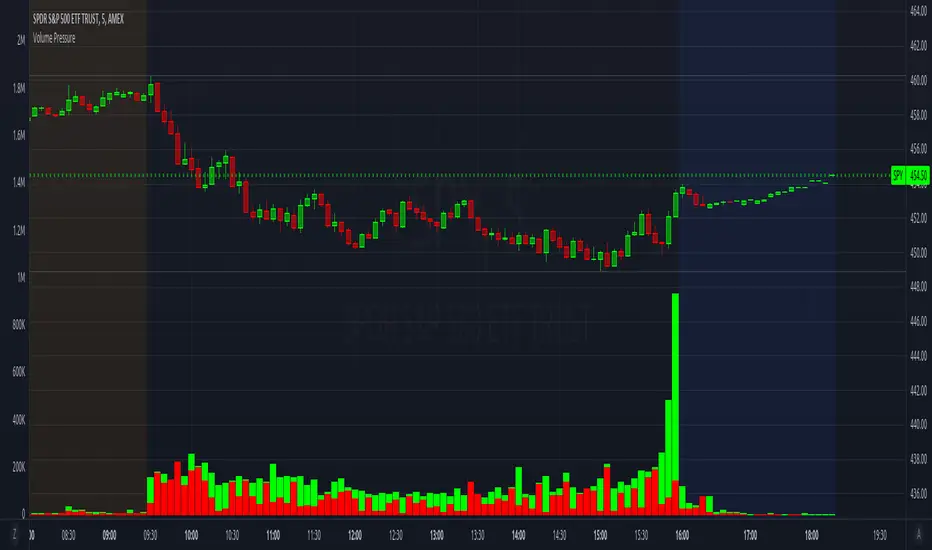
Volume PressureBreaks down volume into buyers (green part) vs sellers (red part).
It is recommended to set the volume's scale, especially if you switch tickers on the same chart. Follow these steps:
Select the Volume Pressure indicator's 3 dots (...)
Select Pin To Scale
Select a separate scale from the main chart, such as Pin To New Left Scale (Z)
Left click and hold the scale on the side of the chart and drag it up/down to bring the volume bars into the desired area
To update to the latest version, just close the indicator and add it again.
Volume by SessionThis indicator shows volume separated by session. The aim is clarify which session a volume bar occurred in and how it compares to the average of that session - NOT ALL SESSIONS.
The logic is that there is little value comparing for example the volume of the London session against volume of the London-NY session - the London-NY will always have higher volume. But how does today's london compare to yesterdays london or the london average.
The indicator has moving averages that only consider the average of previous episodes of the same session - so the average on the london session is the average of the past 5 london sessions (NY and asia and London-NY are not included in the calculation of the MA).
The indicator goes as high as 1H timeframe and the average line does not function below 5 mins - thats a limitation on available data to calculate it.
There's also a 'dark screen' function. Thats because I like a black background so the colours need to be inverted.
Hope its useful. Good luck.
John

Volume ComparisonThis script shows the volume of the current chart relative to the volume of another selected ticker.
For meaningful information you should compare coins with the same base pair (for example BTCUSD against LTCUSD).
Volume bars will be plotted green if the other security's volume is higher, red otherwise.
You may use this script go generate alerts and automate your trading with a bot such as WolfBot.org
